

Weekly GTA Housing Market Brief
Canada Posted Its Best Quarter in Three Years, Washington Answered
With a 50% Tariff Wall, and July Already Flatlined.
Sunday, August 30, 2026 · Peter Kiriazopoulos, Kompass Realty Group
+3.3% Q2 GDP, annualized - fastest since early 2023 | 50% U.S. tariff on Canadian goods, live since Aug 22 | $1,003,956 GTA average price, July - down 4.5% YoY | 4.09% best insured 5-yr fixed - prime still 4.45% |
Welcome back - and my apologies for the three-week gap in this brief. It was an unusually eventful August to be away from the keyboard for, so this week's edition does double duty: it leads with what actually moved in the last seven days, and folds the load-bearing numbers from the missed weeks in where they belong.
Here's the frame I'd use heading into this week. On Friday, Statistics Canada reported the strongest quarter of Canadian economic growth in three years. It is a genuinely good number. It is also, in an important sense, a number from a country that stopped existing on August 22 - the day Washington's 50% tariffs took effect. The quarter being measured ended in June. The shock landed in August. And the very same release put July's growth at zero.
None of that is a housing story on its face. All of it lands on your mortgage, your renewal and your closing costs within the next few months. Let's walk through the four things that matter, and what each means for buyers and sellers across Markham, Stouffville, Richmond Hill, Vaughan, Newmarket, Scarborough and Toronto.
This Week at a Glance
Indicator | Latest | Prior | Read |
Real GDP, Q2 (StatCan, Aug 28) | +3.3% | +0.3% (Q1, revised) | Fastest since early 2023 |
Real GDP, June (monthly) | +0.3% | +0.3% (May) | Solid finish to the quarter |
Real GDP, July (advance est.) | 0.0% | +0.3% (June) | Momentum stopped |
U.S. tariff on Canadian goods | 50% | in effect Aug 22 | CUSMA-compliant included |
Canada's retaliation | ~$20B | effective Sept 8 | Tiered 15% / 25% / 50% |
CPI, July (StatCan, Aug 17) | 3.0% | 2.8% (June) | Gasoline did all of it |
Core CPI (trim / median avg.) | ~2.0% | ~1.9% (June) | Still at target |
GTA average price, July (TRREB) | $1,003,956 | -4.5% YoY | New listings -17.8% |
Best insured 5-yr fixed | 4.09% | ~4.04% (Aug 2) | Prime unchanged at 4.45% |
1. The Best Growth Number in Three Years - For a Quarter That Is Already Over
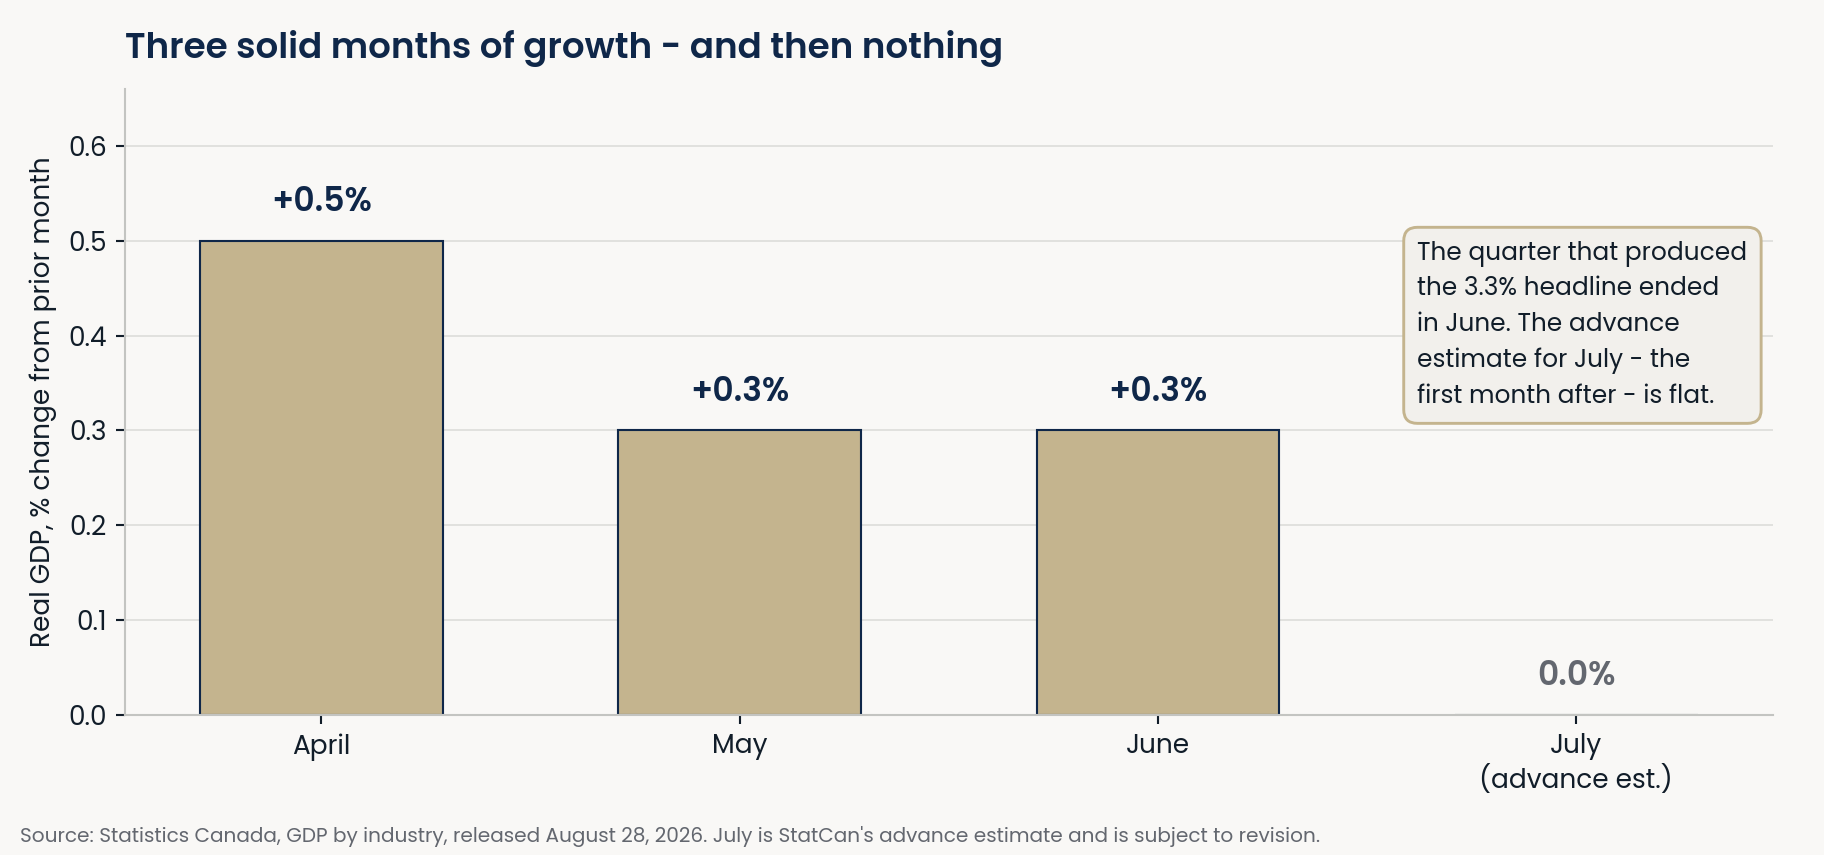
On Friday, Statistics Canada reported that real GDP grew at a 3.3% annualized pace in the second quarter - the fastest quarterly growth Canada has recorded since early 2023, and comfortably above the 2.5% the Bank of Canada itself had pencilled in for the quarter in its July Monetary Policy Report. June came in at +0.3% on the month, a solid finish.
The composition was healthy, which matters more than the headline. Exports rose 3.6%, led by a rebound in shipments of passenger cars and light trucks. Business capital investment rose 2.3%, snapping five consecutive quarters of decline - that is the line I would have least expected to see this year. Household, business and government spending all rose. Inventories were the main drag.
StatCan also used its regular revisions to rewrite the first quarter, which now shows modest growth of about 0.3% annualized rather than a contraction. That quietly ends the recession argument that dominated the spring - not because the economy powered through it, but because on the revised numbers it never happened. BMO's Doug Porter read 3.3% as a strong result against a twenty-year norm closer to 2%, and argued the recession talk from May has effectively been erased. Charles St-Arnaud at Servus Credit Union took it as evidence the economy has enough underneath it to absorb a tariff shock.
And then there is the number almost nobody led with. The same release carried StatCan's advance estimate for July, the first month of the third quarter. It was flat. Zero. Ariane Curtis at Capital Economics made the point plainly: the second-quarter momentum is unlikely to carry into the third, with tariffs arriving and a World Cup-related boost now reversing out. Advance estimates get revised, often meaningfully. But a zero is a zero, and it is the most recent thing we know.
The 3.3% is real. It is also a photograph of a quarter that ended in June - and the shutter closed before the tariff wall went up. |
2. Six Days Before the Good News, a 50% Wall Went Up
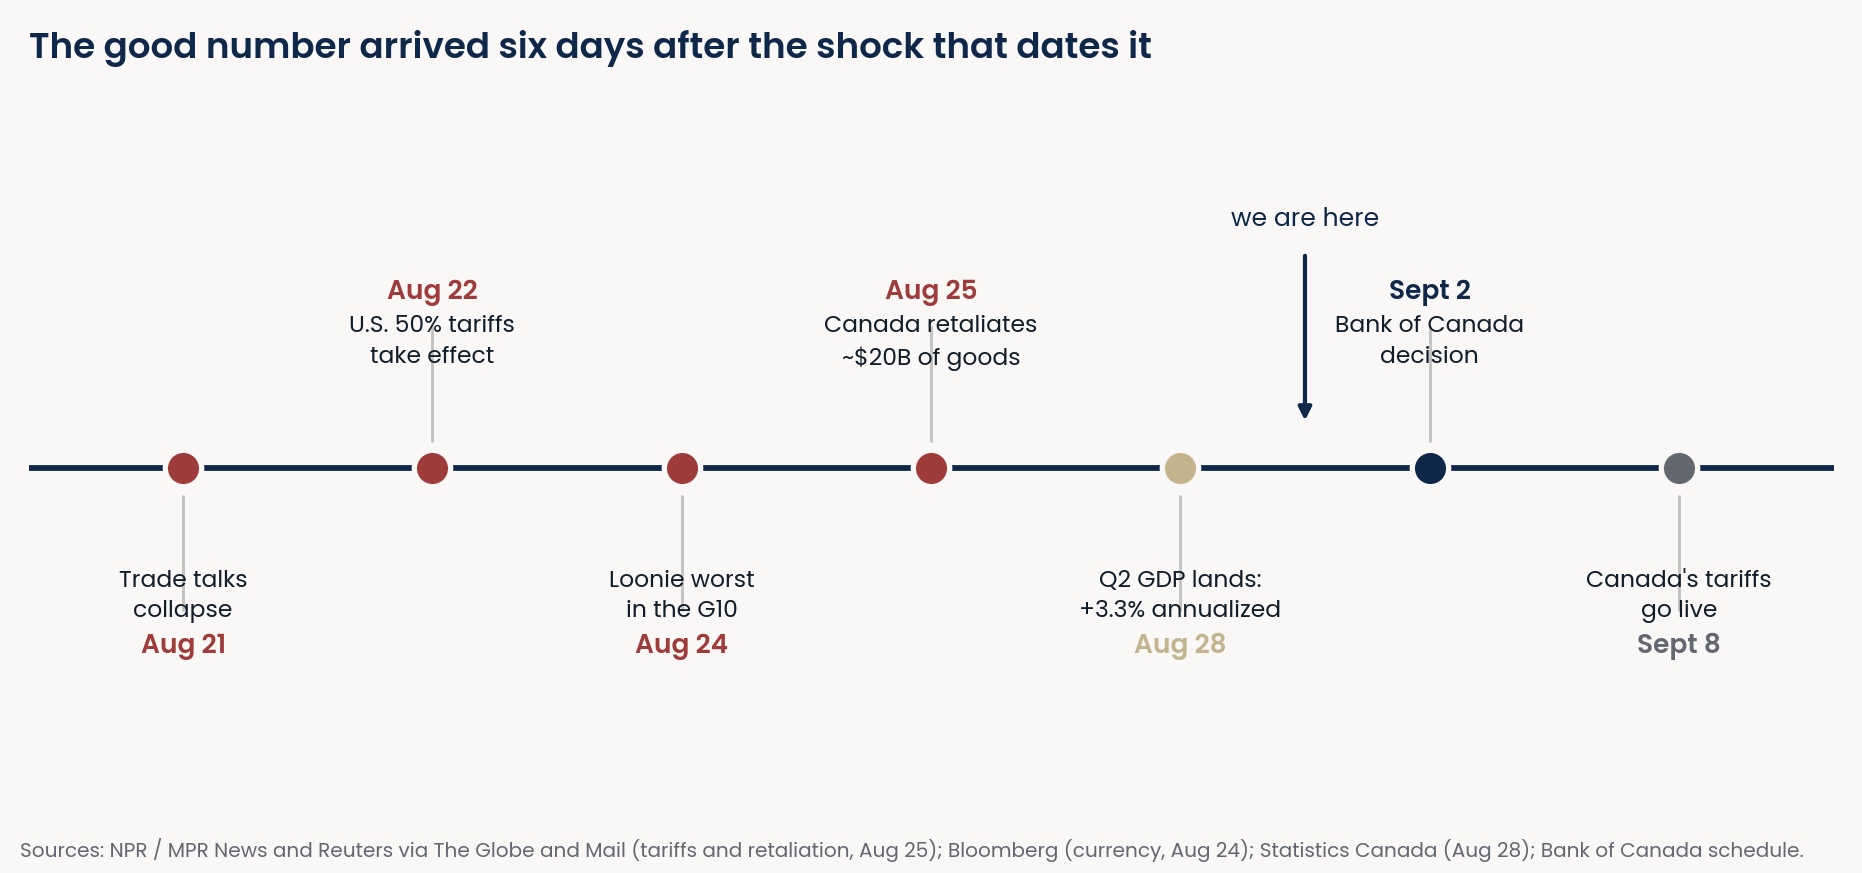
Trade talks between Ottawa and Washington broke down on Friday, August 21. The following day, U.S. tariffs of 50% took effect on a broad range of Canadian goods - dairy, alcohol, electronics, building materials, apparel and a long list of agricultural products among them. Two details make this different from the earlier rounds: the duties apply even to goods that are compliant with CUSMA, the continental trade agreement that was supposed to insulate exactly this trade, and they carry no expiry date.
On Monday, August 25, Canada answered. Finance Minister François-Philippe Champagne announced retaliatory tariffs on roughly $20 billion of American goods - steel, dairy, appliances and farm equipment among the categories - tiered at 15%, 25% and 50% to match the American measures dollar for dollar and rate for rate. Canada's counter-tariffs take effect September 8. Trade analysts put the share of Canadian exports to the U.S. directly caught by the American duties at roughly 5% - painful and concentrated rather than economy-wide, but 5% of a trade relationship that size is a large absolute number.
The most useful reaction came from markets rather than from politicians. The loonie fell as much as 0.7% on August 24 to about C$1.3851, the worst performance in the G10 that day, before steadying near 74.2 U.S. cents. More revealing: Canadian bond yields fell - the 10-year down about nine basis points to 3.68%, the two-year down the same to 2.95%. Read that carefully. Tariffs are, mechanically, inflationary; they raise the price of imported goods. If the bond market thought inflation were the dominant risk here, yields would have gone up. They went down. That is the market saying the growth damage now outranks the price damage - and lower yields are what eventually pull fixed mortgage rates down with them.
One line item deserves a flag for anyone building, renovating or buying new: building materials are on the American list, and steel and appliances are on Canada's. From September 8 there is upward pressure on the cost of finishing a basement in Markham, framing an addition in Stouffville or outfitting a kitchen anywhere in the GTA. If you have a renovation quote in hand, the sensible move is to ask your contractor how long they will honour it.
3. What the Bank Does Wednesday - and What Your Mortgage Does After
The Bank of Canada announces on Wednesday, September 2, and a seventh consecutive hold at 2.25% is as close to settled as these things get - markets had a hold priced at roughly 99% even before the trade talks collapsed. The Bank Rate stays at 2.5% and prime stays at 4.45%. The interesting question is not what happens Wednesday. It is what the Bank says about everything after it.
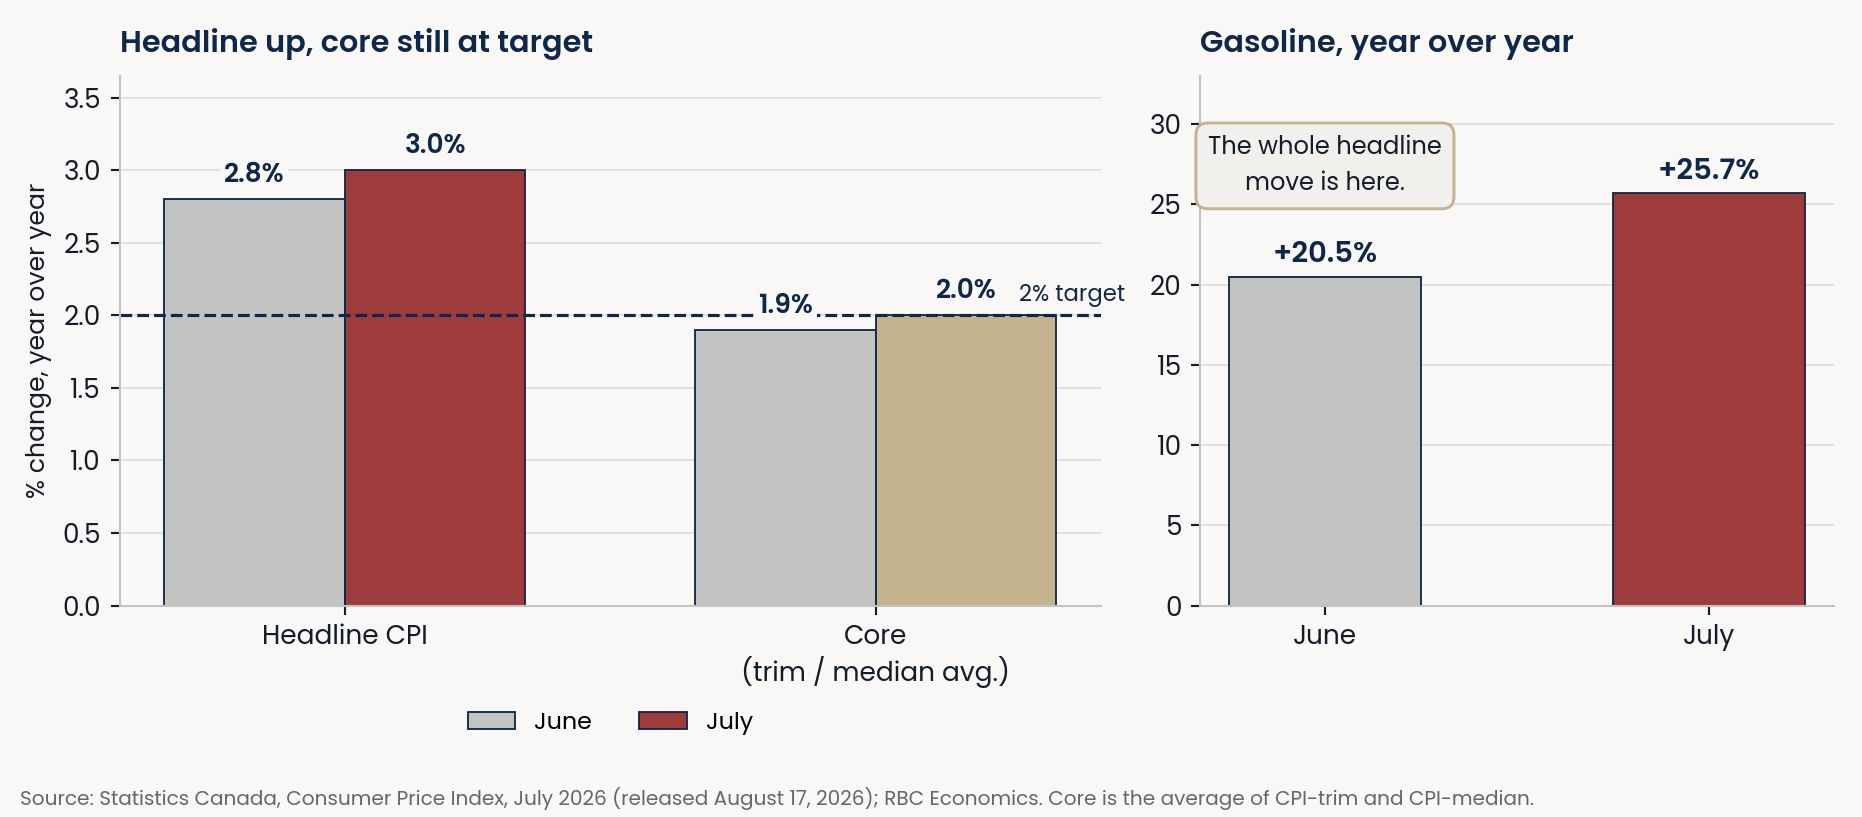
The case against cutting is straightforward. July inflation came in at 3.0%, up from 2.8% in June, near the top of the Bank's tolerance range. Unemployment is 6.4%. Growth just printed at 3.3%. No central bank cuts into that combination. But look at the chart above and the picture gets more interesting: the entire headline move is gasoline, up 25.7% year over year in July versus 20.5% in June, which StatCan attributes to the Strait of Hormuz blockade and Red Sea shipping disruptions. Strip that out and the Bank's own core measures - CPI-trim and CPI-median - are averaging right around 2.0%, with individual measures running as low as 1.8% and some at five-year lows. The inflation is narrow, imported and energy-shaped. It is not broad.
Governor Macklem has been consistent about the framework here, and it is worth understanding because it explains why the Bank will not react quickly to the tariffs in either direction: monetary policy cannot restore supply that trade barriers have destroyed, and a tariff's first effect is a one-time step up in the price level rather than ongoing inflation. On that logic the Bank would only cut if tariffs destroyed enough demand to open genuine slack in the economy - and that takes several quarters of data to establish, not one bad month.
Now let me own a reversal, because this brief has been wrong-footed twice in six weeks and you deserve to see it rather than have it quietly edited out. In mid-July I wrote that the Bank had named oil as its hike trigger. On August 2 I wrote that markets had moved to something close to a coin flip on a hike by December. Four weeks later, a tariff shock has partly unwound that: TD Securities still sees a hold through 2026 and a path back toward a 2.75% neutral rate in 2027, while BMO now argues the Bank's bias should tilt toward cuts rather than hikes. Falling bond yields side with BMO. The honest summary is that the next move is genuinely uncertain in both directions, and I would rather hand you that than a tidier story.
What it means in practice. The best insured five-year fixed is around 4.09%, with the sharpest quotes in the 3.94% to 4.09% range depending on lender and insured status; the Big Six average closer to 4.92%, which is your reminder that the posted rate at your own branch is not the market. The best five-year variable sits in the mid-3s, roughly 3.35% to 3.65%, against prime at 4.45%. The five-year Government of Canada yield that drives fixed pricing is about 3.22%.
When the next move could credibly be a cut or a hike, the gap between fixed and variable stops being a bet on direction and starts being an insurance premium. Decide which one you are actually buying. |
With roughly 1.15 million Canadian mortgages renewing this year, the practical advice has not changed and is not complicated: get a rate hold in writing and take the longest one offered. A hold costs nothing and expires harmlessly. In a market where the central bank itself is waiting for several quarters of data, free optionality is the only genuinely good deal on the table.
4. The GTA: Listings Are Falling Much Faster Than Sales
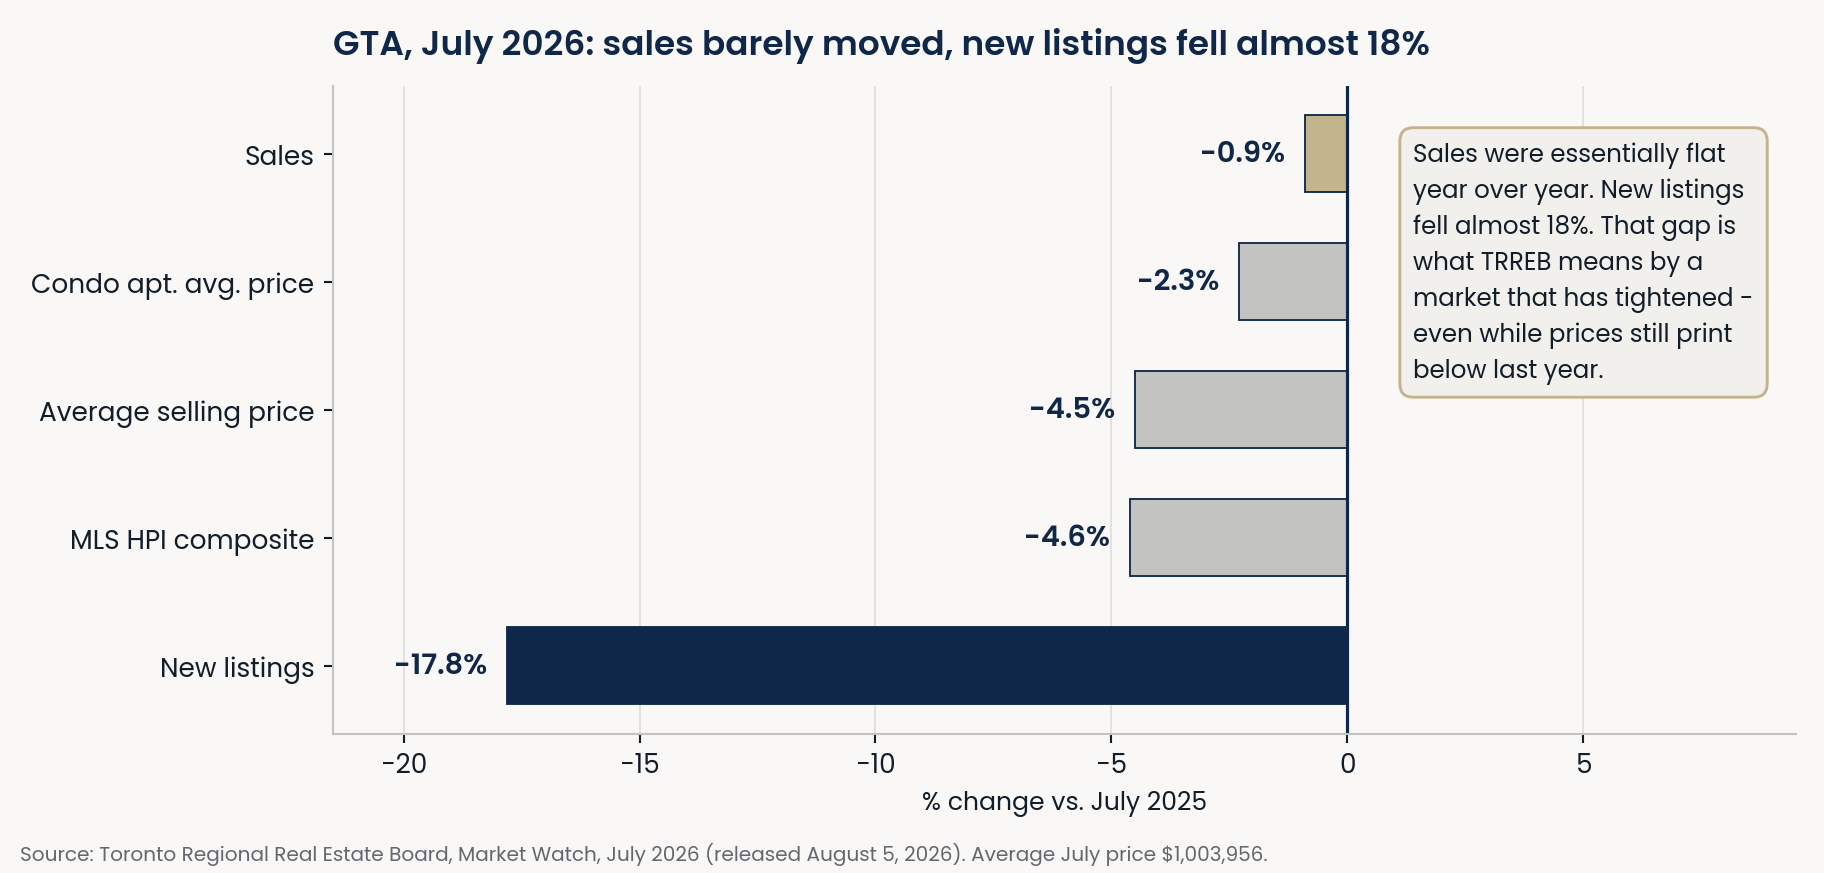
TRREB's July Market Watch landed on August 5, during the gap in this brief, and it is the most quietly significant local data of the month. Sales were 5,995, down just 0.9% from July 2025 - essentially flat. New listings were 14,484, down 17.8%. The average selling price was $1,003,956, down 4.5%, with the MLS Home Price Index composite down 4.6%. TRREB's own framing was that conditions tightened and set the stage for price stability, and for once that is not spin - when demand holds flat and supply falls by almost a fifth, the arithmetic moves in one direction.
I want to be careful not to oversell that, because the price line is the one clients actually feel. Prices are still printing below last year, and buyers still have genuine choice. The inventory backlog built up over the past two years is real and is clearing gradually rather than disappearing. John Pasalis at Realosophy, writing in the Globe in early August, put low-rise months of inventory just under four in June and expects prices to plateau rather than climb once that normalizes toward 2.8 to 3 months. He also described something I see constantly in York Region right now: seller fatigue - long-tenured owners with substantial equity who accept a lower number simply to get on with their lives. National Bank's Alexandra Ducharme framed the sales improvement as affordability-driven rather than a sign of underlying strength. Both readings are correct, and both are compatible with a market that is tightening.
The condo picture has genuinely changed shape. July condo apartment sales were 1,564, down just 1.5%, at an average of $636,323 - down 2.3%, which is a shallower decline than the overall market. For most of the past two years condos led the losses; in July they did not. Behind that, the pipeline keeps shutting off: combined pre-construction and under-construction condo inventory is down 37% year over year to 48,710 units, roughly 62% below the 2022 peak, with no new project launches in the second quarter.
The broader supply data says the same thing. CMHC reported on August 18 that July housing starts fell 5% to a 229,074 annualized pace, from 240,773 in June. Toronto starts were down 10% on weaker multi-unit activity, Vancouver down 42%, Montreal up 3%. Units under construction were essentially flat at 373,091, while completions rose 8.1% to 19,773 - the existing pipeline is emptying out and very little is being started to replace it. Today's ample inventory and tomorrow's shortage are sequential, not contradictory, and the tariffs on building materials do not help the second half of that sentence.
Finally, a useful reminder that "the market" is not one thing. Wahi data reported by CP24 on August 22 showed July days-on-market ranging from 10 days in Etobicoke's Alderwood to 77 days in midtown Toronto's Chaplin Estates. Palmer in Burlington sold in 15 days, Uptown Ajax and Dovercourt Park in 16, Humber Bay in 17, with neighbourhoods in Markham, Milton, Whitby and North York also clearing inside 17 days. At the slow end sat Tansley Woods at 71 days, Bronte Lakeshore at 65, the Burlington waterfront at 64 and Brampton's Queen Street corridor at 62. The pattern is consistent and it is the whole strategy: family-friendly, move-in-ready freehold sells fast; luxury and condo-heavy pockets sit. A well-prepared detached home in Stouffville, Markham or Richmond Hill is in the first category. It has to actually be prepared.
Peter's Take
The thing I keep coming back to this week is vintage. Almost every number in the headlines right now describes a period that ended before the most important thing happened. The 3.3% is a June-and-earlier number. TRREB's July data predates the tariffs. Even the inflation print is a July reading. The only genuinely post-tariff data we have is a flat July GDP estimate and a bond market that quietly repriced toward slower growth. That is a thin evidentiary base, and anyone telling you with confidence what the next six months look like is guessing with extra steps.
What I am reasonably confident about is narrower. Supply in the GTA resale market is tightening while prices are still below last year - that combination does not usually last long. And the direction of borrowing costs is now genuinely two-sided rather than one-way. Those two facts, together, argue for acting on your own timeline rather than trying to time a macro picture that just proved it can turn over in a single week.
If you're buying: get a written rate hold now and take the longest term offered - it is free optionality in a genuinely two-sided rate environment. Then stop watching rates and start watching houses. New listings down almost 18% means the selection you are seeing today is the best selection you will see for a while, and prices are still printing below last year. If you are looking at anything new-build or renovation-dependent, ask about material costs before September 8.
If you're selling: the tightening is real and it is in your favour, but it is a supply story, not a price story - not yet. Price to today's comparables, not to 2022. The days-on-market spread from 10 to 77 in the same month, in the same region, is entirely a story about preparation, pricing and property type. Homes that are ready and realistically priced are moving in under three weeks. The rest are still sitting.
If you're investing: the condo segment finally stopped underperforming the broader market in July, and with the pipeline down 37% year over year the medium-term supply case is intact. But underwrite it at today's money and today's rents. A deal that works at 4.09% fixed and current Toronto rents is a real deal. A deal that only works if the Bank cuts and rents rebound is a forecast wearing a spreadsheet.
Three things to watch this week: the Bank of Canada on Wednesday - not the hold, but the language on tariffs and on how long it intends to look through energy-driven headline inflation; Canada's counter-tariffs going live September 8; and TRREB's August Market Watch in the first week of September, which will be the first local read that has any post-tariff information in it at all. I will have all three for you next Sunday.
As always - if you want to know what any of this means for your specific street, your specific price band or your specific timeline, that is the conversation I would rather have than a general one. Reach out any time.
Sources
• Statistics Canada - "Gross domestic product, income and expenditure, second quarter 2026," The Daily, August 28, 2026: www150.statcan.gc.ca/n1/daily-quotidien/260828/dq260828a-eng.htm
• BNN Bloomberg / CP24 / The Canadian Press - "Economy grew 3.3% annualized in Q2 as StatCan revisions settle recession debate," August 28, 2026 (comments from Doug Porter, BMO; Ariane Curtis, Capital Economics; Charles St-Arnaud, Servus Credit Union)
• MPR News / NPR / Associated Press - "Canada strikes back at U.S. with retaliatory tariffs as trade war escalates," August 25, 2026 (Finance Minister François-Philippe Champagne; ~$20B, tiered 15/25/50%, effective September 8)
• U.S. News & World Report - "U.S.-Canada Trade War: Which Products Face Canada's 50% Tariff?", August 26, 2026
• Bloomberg - "Canadian dollar tumbles as trade rift threatens growth outlook," August 24, 2026 (loonie and Government of Canada bond yield moves)
• Statistics Canada - "Consumer Price Index, July 2026," The Daily, August 17, 2026: www150.statcan.gc.ca/n1/daily-quotidien/260817/dq260817a-eng.htm
• RBC Economics - "Canadian inflation edges higher in July while underlying pressures remain contained," data flash, August 17, 2026
• MoneySense - "Bank of Canada interest rate announcement: What to expect on September 2," August 27, 2026 (Jamie David, Ratehub)
• Mortgages for Less - "Will the Bank of Canada Cut Rates on September 2? Tariffs, Stagflation, and the Answer Nobody Wants," August 24, 2026 (market-implied hold probability, mortgage and bond yield levels)
• FXStreet - "Bank of Canada: Rates seen on hold then higher - TD Securities," August 24, 2026
• Bank of Canada - "Bank of Canada maintains the policy rate at 2¼%," July 15, 2026, and the July 2026 Monetary Policy Report: bankofcanada.ca/2026/07/fad-press-release-2026-07-15/
• Ratehub.ca / nesto.ca / WOWA.ca - Canadian mortgage rate, prime rate and bond yield tracking, week of August 24-30, 2026
• TRREB - "GTA Housing Market Tightens in July and Sets the Stage for Price Stability," Market Watch, July 2026, released August 5, 2026
• CMHC - "Housing starts and construction data for July 2026," released August 18, 2026; BNN Bloomberg coverage, same date
• The Globe and Mail - "A buyer's golden opportunity: a homeowner eager to move on," August 5, 2026 (John Pasalis, Realosophy Realty; Alexandra Ducharme, National Bank of Canada)
• CP24 - "These are the GTA neighbourhoods where homes are sitting on the market the longest," August 22, 2026 (Wahi analysis of July 2026 MLS data)
• CNBC - Brent crude and Strait of Hormuz coverage, August 10-24, 2026
Peter Kiriazopoulos, Sales Representative · Kompass Realty Group · RE/MAX Ultimate Realty Inc., Brokerage · 1739 Bayview Avenue, Toronto
This brief is provided for general information only and is not intended as financial, mortgage, legal or tax advice. Market data is sourced as cited above and is subject to revision. Not intended to solicit buyers or sellers currently under contract with another brokerage.